Once again, academic achievement scores for American children are down. And once again spending is up.
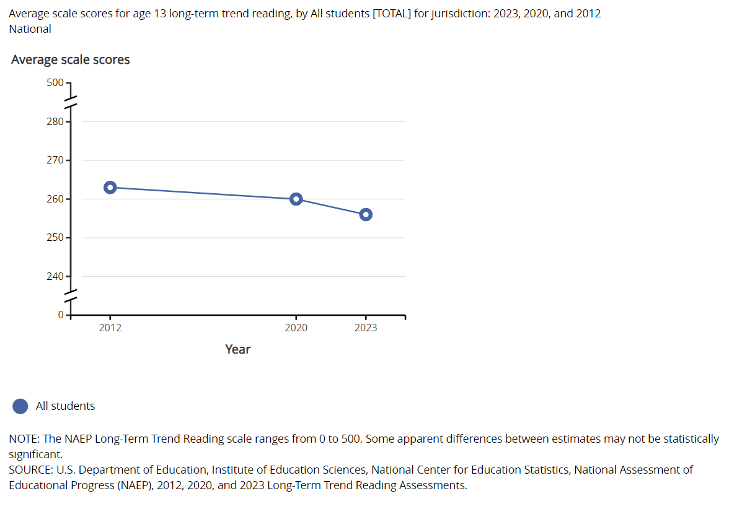
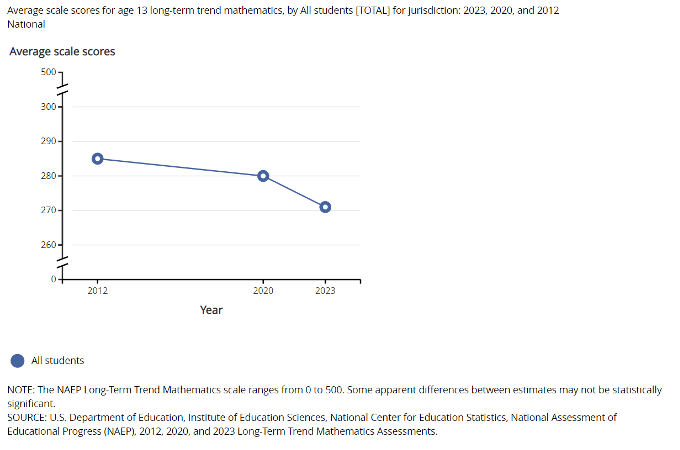
The newly released National Assessment of Educational Progress (NAEP) scores for 13-year-olds for the 2022-2023 school year show a four-point decline in reading ability and a nine-point decrease in mathematics skills since the previous assessment, in 2019-2020. Those numbers on “The Nation’s Report Card” are, respectively, seven points and 14 points below the scores U.S. children achieved 10 years ago—decreases of about 2.7 percent and 4.9 percent.
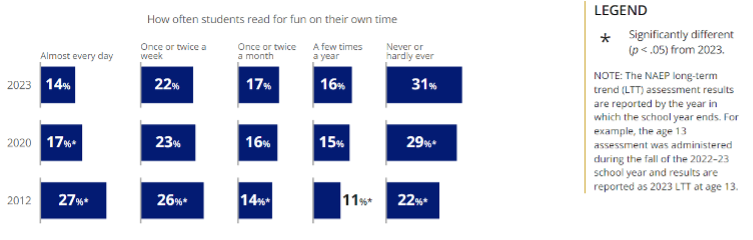
The proportion of students who said they read for fun is the lowest ever measured: “the percentage of 13-year-old students who reported reading for fun almost every day was lower in 2023 than in all previous assessment years,” the report states. Barely half as many students read for pleasure daily as did so 10 years ago:
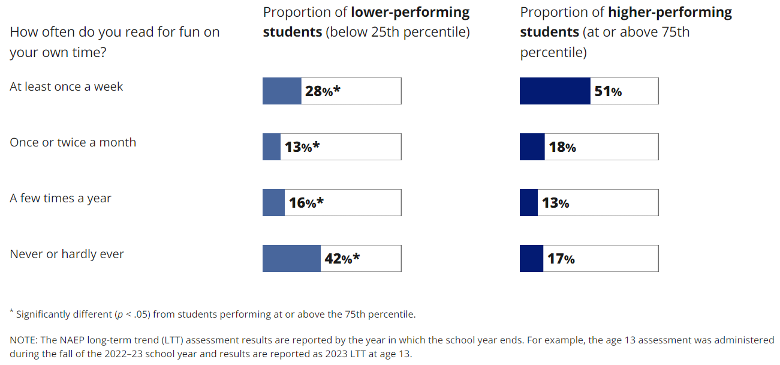
The report is careful to note that the figures cannot establish causality, though the results show reading for pleasure is clearly associated with higher achievement. “Fifty-one percent of 13-year-old students scoring at or above the 75th percentile in 2023 reported that they read for fun on their own time at least once a week, whereas 28 percent of 13-year-old students scoring below the 25th percentile reported doing so,” the report states.
(Here are the boring methodological details: the results “reflect the performance of a nationally representative sample of 8,700 thirteen-year-olds in each subject. Performance comparisons are based on statistically significant differences between assessment years and between groups,” reports the National Center for Education Statistics, which conducts the NAEP.)
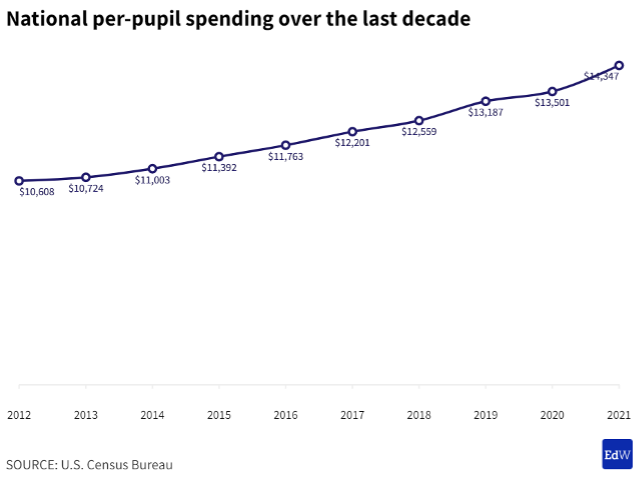
The most recent data, for the 2020-2021 school year, show the nationwide average spending per K-12 student was $14,347, up from $13,501 in fiscal year 2020 and $10,608 a decade earlier, according to Education Week. That is about a 14.3 percent increase in inflation-adjusted dollars.
Here’s what the trend in reading scores for 2012 to the present looks like:
And here’s the trend in math scores for 2012 to the present:
Here’s what the spending trend for that period looks like:
Higher spending, worse achievement.
Despite the numbers showing spending is up and achievement down, people still commonly argue that more money will fix the nation’s broken education system:
Higher spending on education correlates with higher economic outcomes for students. A study published in the Quarterly Journal of Economics revealed that “a 10% increase in per-pupil spending each year for all 12 years of public school leads to 0.31 more completed years of education, about 7% higher wages, and a 3.2 percentage point reduction in the annual incidence of adult poverty” (Jackson et al., 2016).
That may sound encouraging. However, a 10 percent increase per year for 12 years is more than a tripling of spending over that period. (If it was not compounded in the original study, which I could not verify, that’s still more than double the spending.) The improvements observed in that study don’t appear very impressive in that light. Moreover, the writer uses the word “correlates,” because the numbers cannot show that the (very large) spending increases caused the (meh) increases in wages, etc. That makes the increased spending an even worse investment.
As the numbers show once again, our education system is broken. Spending up, achievement down.
Sources: The Nation’s Report Card; Education Week